Dashboard
The Dashboard is the first page you see after signing in (and you can return to it any time from the top of the sidebar). It gives you an at-a-glance summary of your inspections and observations, and lets you drill straight into the underlying records.
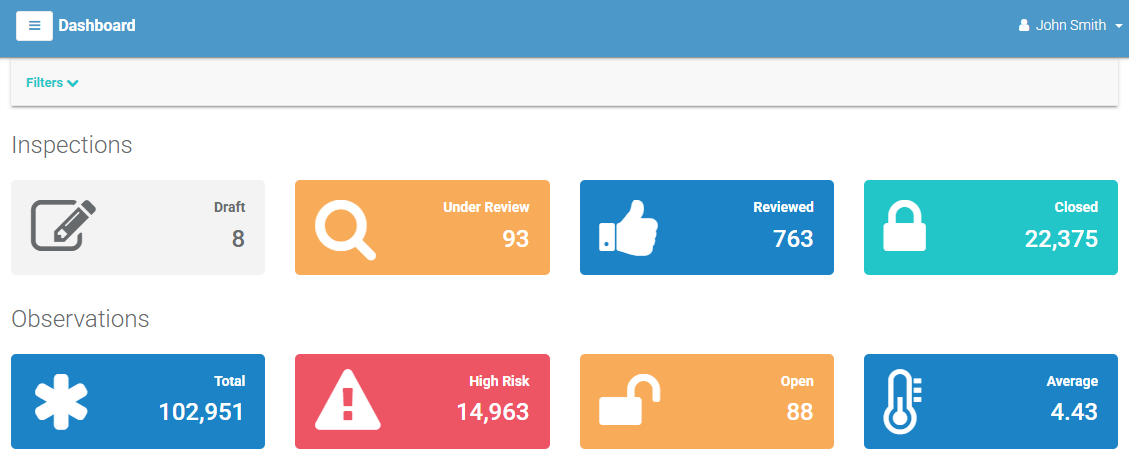
Summary tiles
The Dashboard shows two rows of summary tiles:
- Inspections — counts such as totals and key inspection groupings.
- Observations — counts such as open and overdue observations.
Each tile shows an icon, a label, and a number.
Select any tile to load the matching records in a table below the tiles — for example, selecting an observations tile lists those observations, and selecting an inspections tile lists those inspections. From there you can open any row just as you would on the Inspections or Observations pages.
Filtering the Dashboard
Select Filters at the top to focus the summary on what matters to you. As you change filters the tiles and table update, and [ Clear All ] resets them. You can filter by:
- Vessels
- Responsible User
- Model Type
- Period — a date range, with quick presets.
Tip
Use the Dashboard as your daily starting point: filter to your vessels or your date range, glance at the open/overdue observation tiles, then drill in to act on anything that needs attention.